Pivot Table in Excel is the popular data report format, which is similar to an OLAP cube that aggregates data at any dimensions. To create a pivot table for a table with lots of columns, it usually takes 100+ drags and clicks to get job done, which is somehow annoying.
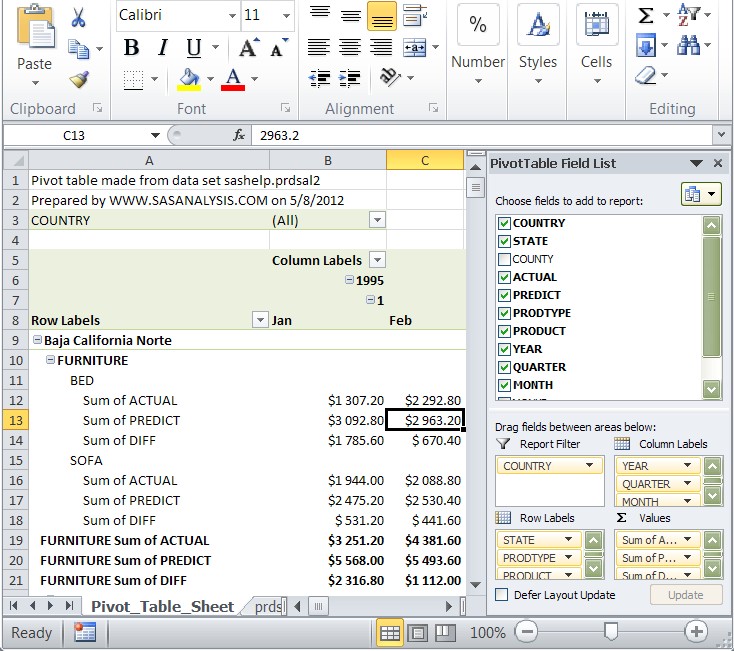
I didn’t try the SAS’s Add-in for Microsoft Office or SAS Enterprise Guide yet. However, an easy solution to transform a SAS data set toward an Excel pivot table is possibly to use some VBA scripts under Excel. For example, SASHELP.PRDSAL2, which is a free data set shipped with SAS, records the furniture sales in 64 states of the three countries from 1995 to 1998, and has total 23,040 observations and 11 variables. This data set can be transformed to an Excel pivot table very quickly by two simple steps.
Step 1

In SAS, a data set can be exported toward an XLS file through ODS destination. Although it is still based on HTLM format, it can be opened by Excel.
ods html file = 'c:\tmp\prdsal2.xls' style = minimal;
title;
proc print data = sashelp.prdsal2 noobs;
run;
ods html close;
Step 2

Next step we click on this file, press ALT + F11 to enter VBA editor, paste the VBA code below and run it. Then the pivot table is created. The good thing about this method is that the pivot table can be replicated anywhere by such a VBA subroutine, and it is customizable for particular needs. The example was finished in Excel 2007.
Sub createPT()
'   Set storage path for the pivot table
    myDataset = "sashelp.prdsal2"
    myFilepath = "c:\tmp\" & myDataset & "_" & Format(Date, "dd-mm-yyyy") & ".xlsx"
    Dim myPTCache As PivotCache
    Dim myPT As PivotTable

'   Delete the sheet containing the previous pivot table
    Application.ScreenUpdating = False
    On Error Resume Next
    Application.DisplayAlerts = False
    Sheets("Pivot_Table_Sheet").Delete
    On Error GoTo 0

'   Create the cache
    Set myPTCache = ActiveWorkbook.PivotCaches.Create( _
        SourceType:=xlDatabase, SourceData:=Range("A1").CurrentRegion)

'   Add a new sheet for the pivot table
    Worksheets.Add
    ActiveSheet.Name = "Pivot_Table_Sheet"

'   Create the pivot table
    Set myPT = ActiveSheet.PivotTables.Add( _
        PivotCache:=myPTCache, TableDestination:=Range("A5"))
    With myPT
        .PivotFields("COUNTRY").Orientation = xlPageField
        .PivotFields("STATE").Orientation = xlRowField
        .PivotFields("PRODTYPE").Orientation = xlRowField
        .PivotFields("PRODUCT").Orientation = xlRowField
        .PivotFields("YEAR").Orientation = xlColumnField
        .PivotFields("QUARTER").Orientation = xlColumnField
        .PivotFields("MONTH").Orientation = xlColumnField
        .PivotFields("ACTUAL").Orientation = xlDataField
        .PivotFields("PREDICT").Orientation = xlDataField
        .DataPivotField.Orientation = xlRowField
        '  Add a calculated field to compare the predicted value and the actual value
        .CalculatedFields.Add "DIFF", "=PREDICT-ACTUAL"
        .PivotFields("DIFF").Orientation = xlDataField
        ' Specify a number format
        .DataBodyRange.NumberFormat = "$#, ##0.00"
        ' Apply a style for pivot table
        .TableStyle2 = "PivotStyleLight18"
    End With
    Range("A1").FormulaR1C1 = "Pivot table made from data set" & " " & myDataset
    Range("A2").FormulaR1C1 = "Prepared by WWW.SASANALYSIS.COM on " & Date
    ActiveWorkbook.SaveAs Filename:=myFilepath, _
        FileFormat:=xlOpenXMLWorkbook, CreateBackup:=False
End Sub
Ref:www.sasanalysis.com