Recently while browsing on net, found very good paper about
“How to create a Business Intelligence Strategy” presented in SAS Global forum 2012 by Guy Garrett, Achieve Intelligence Limited, Brighton, East Sussex, United Kingdom and thought of sharing it….
How to create a Business Intelligence Strategy
You may wonder how some organizations are so astute at managing to keep abreast of changing customer behavior in the market. There are undoubtedly many factors – however central to the answer is that they recognize the value of their information assets and alter their strategic vision with new perspective.
A Business Intelligence Strategy is a roadmap that enables businesses to measure their performance and seek out competitive advantages and truly “listen to their customers” using data mining and statistics.
WHAT IS A BUSINESS INTELLIGENCE STRATEGY
In 1958, IBM researcher Hans Peter Luhn summarized “the ability to apprehend the interrelationships of presented facts in such a way as to guide action towards a desired goal” as Business Intelligence.
Today, would he be surprised to know that many companies fail to create a BI Strategy, resulting in misalignment of their strategic vision versus it’s execution. In a performance related culture we should be clear about what we measure, as organizations, and how to drive improvement from our analyses.
Statistics are used throughout the media and in day-to-day life to try to make sense of why events have happened the way they have and to try and predict how they may happen in the future.
In business there are occasions when, despite the statistics, companies can still perform well. But this is an exception to the rule. It is generally accepted that analyzing your data gives your company the ability to measure success, and to take advantage of competitive opportunities.
On the back cover of Competing on Analytics by Davenport & Harris (ISBN-13:978-1-4221-0332-6) Dr Jim Goodnight states “As the future unfolds…more business decisions will be supported by the facts that only analytics can provide; and fewer business decisions will be made on the basis of instinct and guesswork”.
It is surprising therefore, how many companies have not made the critical investment required in a Business
Intelligence Strategy. Often large programmes of development are directed towards operational systems, to enhance customer experience, as it should be. Yet often little thought is given to measurement and analytics of the data goldmine captured by those same systems.
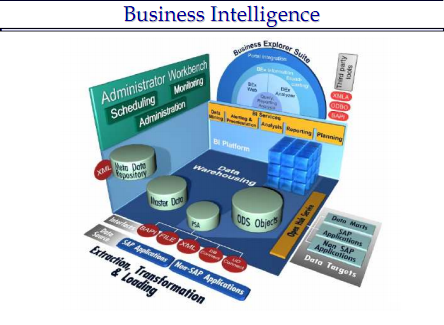
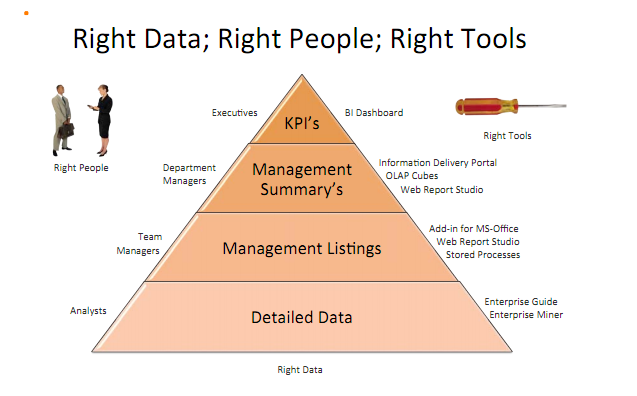
The Business Intelligence afterthought is very often minimal and reactive – which leads to a whole host of problems.In the era of analytics, it is crucial to create a Business Intelligence Strategy that is aligned with your overall corporate strategy.SAS Software is a truly Enterprise wide technology which can underpin the implementation of a Business Intelligence Strategy; from capturing the correct data initially through to integrating all manner of sources to then be able to exploit and analyze the information within. SAS Software offers the right tools for the right people to access the right data.
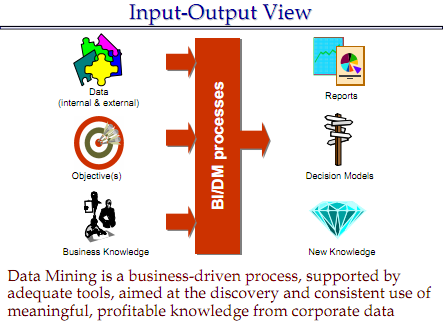
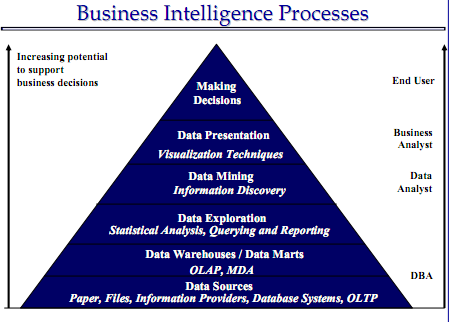
Figure 1 is a diagram of how to get the right data to the right people using the right tools.
WHY DO I NEED A BUSINESS INTELLIGENCE STRATEGY?
Much of a businessʼ information assets increase over time, whether it is through acquisition or organically. Either way unstructured data can become a sprawling chaos rather than a well-structured asset. Many gardeners will be happy to spend hours telling you where to plant your cabbages as opposed to your peas. Indeed any gardener who gathered all their seeds together and liberally scattered them around would have little success in returning a yield. Even if a garden is planted strategically it takes care over time to keep it. If left with no maintenance then it becomes overgrown and difficult to manage.There are five common problems that stem from not having a Business Intelligence Strategy:
MULTIPLE VERSIONS OF THE TRUTH
How often have you been in a crucial business meeting; to set strategy, review performance or mitigate against risks; where several people bring different data to backup their findings. The “SVOT” (single version of the truth) becomes a utopian dream the larger the organization gets. Until that is achieved a lot of time can be wasted discussing how figures have been derived, rather than creating effective business decisions.
UNCLEAR BUSINESS LOGIC
Another problem is that calculations can have different definitions and names for the same measure, or worse the same name with different definitions. A classic example in the insurance industry is the definition of a claim. Is that related to the incident that occurred or the treatments incurred? A whiplash claim may need 5 treatments to put right -so when counting the number of claims is that 1 or 5? In this case it may not really matter, as long as the whole organization is consistent in their definition.
PERSONNEL OVERHEAD
There can be many areas in an organization that derive their own Business Intelligence. Depending on the size of the company this can lead to an overhead in personnel. Larger enterprises can definitely benefit from a Business Intelligence Competency Centre; others may combine a self-service approach, with a small number of detail analysts for ad-hoc investigations.
ANALYSTS PROGRAMMING, NOT ANALYSTS ANALYSING
The right people, using the right tools, against the right data ensures maximum efficiency to your bottom line. Too often, highly paid analysts spend their valuable time writing programs to extract data, rather than adding their expertise into interpreting result sets.
DATA QUALITY ISSUES
The old adage of “Garbage In, Garbage Out” is another symptom of an organization with no Business Intelligence Strategy. Data quality becomes an afterthought as everyone’s so focused on generating the figures, (any figures!), in time for the next meeting. A Business Intelligence strategy should think about data quality up-front.
REASONS FOR CHAOS: BEFORE A BUSINESS INTELLIGENCE STRATEGY
Many organizations find themselves in this situation; therefore blame shouldnʼt be apportioned to one reason or another. Indeed perhaps it is a necessary to arrive at a state of chaos before understanding the need and benefits of a BI strategy. There is surely no need to set up a BICC for an organization of only 20 people. The trick, however, is to identify where the tipping point is – and not leave it too late before creating a strategy.
Some reasons for arriving at BI chaos are:
• Organic growth
• Reactive reporting
• Little up-front investment
• No aligned strategy with corporate direction
• Pockets of development and governance
• Blurred line between operational reporting, business intelligence and analytics
• Limited feedback loop to drive business from data
FIVE KEY AREAS OF STRATEGY
Assuming you need a BI strategy, or to update an existing one, there are five key areas of consideration:
1. BI Roadmap – for use as a start-up to a BI strategy implementation project.
2. Stakeholder Management – getting the right people involved at the right level.
3. Architectural Blueprint – how the BI estate will look and operate.
4. Capability Improvement – what needs upgrading, re-developing or decommissioning
5. Implementation Planning – how to approach implementing the roadmap to take you from here to there
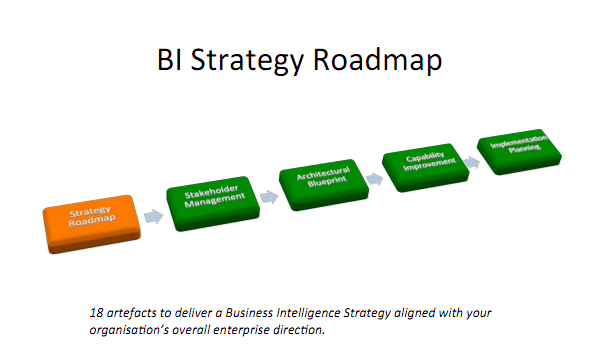
BI STRATEGY ROADMAP
Figure 3 gives an overview of the BI strategy Roadmap.
Figure 3. BI Strategy Roadmap.
The old story of asking directions and being told “Well if you want to get to there, I wouldnʼt start from here” is quite apt. On the quest to find organized information there are many twists and turns, cul-de-sacs and blind alleys. A BI Roadmap should explain what is in scope and what is not covered by the strategy. The most important piece of work is to understand if your Business Intelligence provision is in-line with your corporate strategy. We know this can be sensitive as not all organizations like sharing their strategy, but for those that do, it’s crucial to ensure their BI offering can measure their critical goals. For example, there’s no point concentrating on marketing intelligence if the company is moving away from direct sales to use partners and agents. This is simply a matter of communication and asking the right people the right questions. For those organizations that don’t share their high-level strategy, it’s essential to get buy-in from someone on the board to steer the direction. BI means different things to different people. To one it may be general management information to others operational reporting can be included, yet to another it may just be a highly technical niche department running some heavy duty statistics. Therefore it’s essential at the outset to determine your definition of Business Intelligence.
Another important aspect is what areas of the business are you covering? Thus Breadth Analysis is an essential technique to know what is ring-fenced and what isn’t. For example, if you want to perform intense business analytics across the enterprise your strategy will have a different profile to a general reporting team just for marketing results.
STAKEHOLDER MANAGEMENT
Research into the corporate landscape, within which the BI strategy is to be implemented, is essential for itʼs success. Stakeholder Management is one such method to help identify who are the key information consumers, which subject areas are critical to the business and what challenges are in the pipeline to a growing organization.Impact versus Influence. This is an identification routine to determine priorities for the information that is consumed. It moves away from the“who shouts loudest” model which often leads to inaccurate “rush jobs”, stressed team members and unhappy consumers.
Another symptom of reactive information provision is that over time, a build up of short-term urgent-ism is created. Often these reports are very important for a minimal amount of time (i.e. urgent ad-hoc). In MI team scenarios, these can continue to be generated for weeks or months and without proper documentation, or understanding of business needs and can be given wrong priority so that effort is attributed to running reports that no one looks at. Without Impact versus Influence analysis you could be paying attention to a redundant one-off analysis instead of a crucial regulatory report or something that affects your customersʼ experience.
Subject Matter Analysis
All businesses have distinct areas of data from core subjects to more peripheral areas. Analysis should be performed to identify these areas and create a Subject Matter Diagram outlining what is provided for, and what is still needing to be included. As the strategy takes shape, determining which areas are core and need developing further, or which areas are on the periphery; yet could add value, can be captured in the SMD and used to focus development and communicated to stakeholders.
Figure 4 shows an actual example of a customerʼs subject matter diagram. This indicates known areas to develop (the clouds) through to phased implementations of data richness (light colored boxes through to dark colored boxes) and how they combine for the conformed logical data model.
Challenge Analysis
This is an understanding of what project work is coming up, be it one driven by the business (new initiatives), driven by the Market (change in customer buying patterns) or regulatory (Solvency II, European Gender Directive).Without an understanding of what’s in the project pipeline, Business Intelligence managers will end up developing tactical short-termist solutions rather than strategic best-fit scenarios.
CAPABILITY IMPROVEMENT
Sometimes time, money and energy needs to be spent on “People, Processes and Plumbing”. The Capability
Improvement section of the BI strategy looks at what needs to be done in each of these three areas.
People Staff may not be skilled in the latest technologies, or indeed new functions may have been introduced to the business which needs external resourcing or employing-in. Close working with the HR department can develop a skills matrix, identifying training needs, to ensure there are no single points of failure in staffing.
Processes
Similar attention can be turned to the organizationsʼ processes. Again due to organic growth, certain ways of working may have developed which are now no longer the most effective way of delivering information. Six sigma and other process analysis tools can be used to improve on process efficiencies. A Target Operating Model can be designed as a transformational artifact.
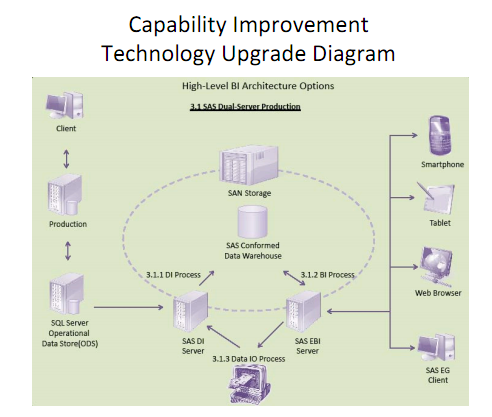
“Plumbing”
The “plumbing” referred to above is the hardware and software infrastructure required to support information delivery. A review of the hardware is often the first area to be investigated – however that’s often under the assumption that the incumbent software will remain unchanged. It is worth investigating which software is best fit for your strategic direction first and then building the hardware architecture around that. Figure 5 shows an actual example of a customerʼs Technology Upgrade Diagram. This is one of three proposed options, which were presented, along with indicative costs for hardware, software, and personnel and estimated development work.
A common example of requiring capability improvement would be that of companies which start life using
spreadsheets and MS-Access databases for MI. As that organization succeeds and grows, however, more
heavyweight analysis tools should be investigated. SAS software has the benefit of providing tools that can support your analysis growth.
IMPLEMENTATION PLANNING
Once the strategy has been defined and agreed by the key stakeholders the next question is how to implement the strategy?Program Management and Release Schedules should be drawn up, with an estimation of costs and timescales. The expected levels of documentation should be determined and the sills required to implement the strategy should be identified.An often-overlooked aspect is to ensure the BI team staff are on-board and involved in the implementation. If an external team is brought in to implement the strategy, then handover should be an on-going process – rather than a last minute activity. This is critical to the success of implementing the strategy.
SAS SOFTWARE AND THE BUSINESS INTELLIGENCE STRATEGY
For many years, SAS Software has been a major player in the Business Intelligence arena. In preparing a Business Intelligence Strategy your organization is obviously committed to an empirical approach to measuring business performance. SAS Software offers tools across the spectrum of BI to enable successful delivery of your business information and analytics.